Total reliability
Case Processing Summary
N %
Cases Valid 215 99.5
Excluded(a) 1 .5
Total 216 100.0
a Listwise deletion based on all variables in the procedure.
Reliability Statistics
Cronbach's Alpha N of Items
.871 20
Reliability even
Case Processing Summary
N %
Cases Valid 215 99.5
Excluded(a) 1 .5
Total 216 100.0
a Listwise deletion based on all variables in the procedure.
Reliability Statistics
Cronbach's Alpha N of Items
.756 10
Reliability odd
Case Processing Summary
N %
Cases Valid 215 99.5
Excluded(a) 1 .5
Total 216 100.0
a Listwise deletion based on all variables in the procedure.
Reliability Statistics
Cronbach's Alpha N of Items
.793 10
Correlations
swbtotal rwbtotal ewbtotal setotal retotal lstotal
swbtotal Pearson Correlation 1 .937(**) .934(**) .117 -.144(*) .380(**)
Sig. (2-tailed) .000 .000 .086 .035 .000
N 215 215 215 215 215 215
rwbtotal Pearson Correlation .937(**) 1 .749(**) .083 -.125 .272(**)
Sig. (2-tailed) .000 .000 .226 .068 .000
N 215 215 215 215 215 215
ewbtotal Pearson Correlation .934(**) .749(**) 1 .137(*) -.144(*) .441(**)
Sig. (2-tailed) .000 .000 .044 .034 .000
N 215 215 215 215 215 215
setotal Pearson Correlation .117 .083 .137(*) 1 -.611(**) .260(**)
Sig. (2-tailed) .086 .226 .044 .000 .000
N 215 215 215 215 215 215
retotal Pearson Correlation -.144(*) -.125 -.144(*) -.611(**) 1 -.111
Sig. (2-tailed) .035 .068 .034 .000 .104
N 215 215 215 215 215 215
lstotal Pearson Correlation .380(**) .272(**) .441(**) .260(**) -.111 1
Sig. (2-tailed) .000 .000 .000 .000 .104
N 215 215 215 215 215 215
** Correlation is significant at the 0.01 level (2-tailed).
* Correlation is significant at the 0.05 level (2-tailed).
Saifuddin,
Dr Sohail.
1) Title of the project
2) Introduction ( background of the study, objective, statement of problem, significance of the study, limitation, and decimation if any.)
3) Literature Review
4) Data analysis and finding
5) Conclusion, comment and recommendations.
6) References/bibliography
Test reliability refers to the proportion of the total variance attributed to true variance.
The greater the proportion of total variance attributed to true variance the more reliable the test.
Hence there are different degrees of reliability.
Test construction:
Item sampling
Content sampling
Test administration:
Test environment
Test taker variables
Examiner-related variables
Test scoring and interpretation
Types of Reliability
1.Test-retest reliability
2. Parallel-forms or Alternate-forms reliability
3. Internal Consistency reliability
3.1 Split-half reliability
3.2 Kuder-Richardson reliability (KR 0)
3.3 Coefficient alpha reliability
4. Inter-scorer reliability
Test-retest Reliability (Temporal Stability Reliability):
1. Obtain a representative sample of the target population.
2. Administer the test on this sample.
3. After some time interval re-administer the same test on the sample.
4. Compute product moment correlation between the test and retest scores to obtain the test-retest reliability coefficient.
What should be the time interval between the two administrations?
Generally, as the time interval between administrations of the test increases the correlation between the scores obtained on each testing decreases.
Length of time interval between the two testing sessions?
The interval should be less than six months.
Report time interval along with test-retest reliability.
Limitations:
Sometimes if the interval is very short, practice, memory, fatigue and motivation may influence the reliability coefficient.
There are possible intervening factors between administrations that can influence the reliability coefficient even if the interval is ideal.
They should be taken into consideration. For example tutorials, counseling or emotional trauma.
Suitability of test-retest method:
This method, which is for estimating the temporal stability reliability, is appropriate for tests that purport to measure a characteristics that are relatively stable over time. E.g., personality test or tests of reaction time or perceptual judgments.
Parallel-forms or Alternate-forms reliability
(Equivalence reliability):
Administer form A on a representative sample
of the target population.
After some interval administer form B on the
same sample.
Compute product moment correlation between
the two sets of scores to obtain the parallel-
forms or alternate-forms reliability.
The objective is to evaluate the degree of relationship between forms of the same test.
The coefficient of reliability obtained is termed as the coefficient of equivalence.
Limitations:
Like in test-retest reliability, test scores are affected by motivation, fatigue and intervening events like practice, learning and therapy, though not as much as in test-retest method.
Suitability of parallel-form or alternate-form method.
It is used for tests that have parallel-forms or alternate-forms and is appropriate for tests that purport to measure relatively stable characteristics.
Internal Consistency Reliability
3.1 Split-half reliability estimate
3.2 Kuder-Richardson formula 20 reliability estimate
3.3 Coefficient Alpha reliability estimate
Split-half Reliability Estimate
1.Administer the test on a representative sample of the target population.
2. Divide the test administered once into equivalent halves randomly, by odd and even method or according to content and difficulty.
3. Compute the product moment correlation between the two pairs of scores obtained
Adjust the half-test reliability using the modified Spearman-Brown formula which is:
Estimates of reliability of the entire test is higher than the reliability estimate of half a test.
Suitability of split-half method:
It is appropriate for homogeneous tests that are unifactorial and inappropriate for heterogeneous tests, which are multifactorial or speed tests.
Kuder-Richardson formula 20
This method does not require the test to be split.
In this method the following formula of Kuder-Richardson is used
Items p q p q
__________________________________
1. .9 .1 .09
2. .85 .15 .1275
3. --- --- ---
4. --- --- ---
Nth. --- --- ---
___________________________________
Σp q
Participants Total Scores
_________________________
1. 20
2. 22
3. 18
4. --
5. --
nth 19
_______________________
=
Suitability of KR-20 statistic:
It is suitable for tests with dichotomous items i.e. items that can be scored right or wrong like MCQ’s
Coefficient Alpha
The Coefficient alpha or Cronbach alpha method:
Items
________________________________
Participants 1 2 3 4 nth. Total
_____________________________________________
1. 4 3 2 5 1 15
2. 3 2 1 3 2 11
3. 2 4 3 2 4 15
nth. 1 3 4 4 2 14
_____________________________________________
= =
Coefficient alpha equals the mean of all possible split-half correlations corrected by Spearman-Brown formula.
Suitability of coefficient alpha:
It is suitable for tests with non-dichotomous items, e.g., Likert type scales.
Inter-scorer Reliability
It is the degree of agreement or consistency between two or more scorers, judges or raters
Factors Affecting Reliability Coefficients
1. Range of scores
2. Length of test
3. Probability of guessing (nilai P<0.05 mean 95%…nilai P<0.01 mean 99%…
C = (R – W) ÷ (N-1)
C = the corrected score;
R = number of correct responses;
W = number of incorrect responses;
N = number of alternatives available.
Kline (1993,2000) proposed to have five responses
instead of four for multiple-choice items and make sure
the four incorrect responses are “equally attractive.”
Reliability=alpha=coefficient correlation…
Reliability=coefficient correlation= alpha= biasa nak 0.75 hinggga 0.9 highly reliable
Validity Definitions
• The validity of a test is a judgment or estimate of how well a test measures what it purports to measure in a particular context (Cohen & Swerdlik, 2005).
The validity of a test concerns what the test measures and how well it does so (Anastasi & Urbina, 1997). It tells us what can be inferred from the test scores
Validity ada dua jenis:
1.convergent
2.discriminant
Cuba lihat scree plot adakah negative atau posotif
Jika positive mean ada hubungan antara variable yang cuba dihubungkan mean directly relationship
Jika negative mean investly relationship
Nilai validity kita rujuk kepada nilai standard error…jika SE tinggi mean tidak valid…low validity
Content validity describes a judgment of how adequately a test samples behaviour representative of the universe of behaviour that the test was designed to sample. (Cohen & Swerdlik, 2005).
Standard Error of Measurement
Let’s assume that the SD for a test is 10 and its reliability coefficient is .90. We use these numbers to derive the standard error of measurement:
= 3.0
We use this number to calculate a confidence interval.
The standard error of measurement is a type of standard deviation that indicates the amount of variability due to measurement error.
An examinees true score, at the 68% confidence interval, would fall between + or –1SEms of his/her obtained score; at the 95% level, the true score would fall between +or-2SEms; and finally at the 99% level, the true score would fall between + or -3SEms
The standard error of measurement is used to construct a confidence interval, or range within which an examinee’s true score is likely to fall.
Example:
Examinee’s obtained score is 90.
90 ± 1(3.0) = 87 – 93
90 ± 2(3.0) = 84 – 96
90 ± 3(3.0) = 81 – 99
Increasing or decreasing the reliability and the standard deviation affects the standard error of measurement
Jika nilai alpha tinggi then SD rendah SE measurement juga rendah
Standard Error of Estimate
Assuming SD = 10 and criterion-related validity = .36
Jika SE rendah mean high validity
Jika SD tinggi biasanya SE jua tinggi…
P<0.05.... mean 95% ada significant relationship...mean highly reliability relationship between the variable
P<0.01...mean 99% ada significant relationship...mean highly significant relationship between the variables
Jika dua categories (biasanya variable…kita pakai T test…atau Chi Square
Jika tiga (>2…categories / variable yang kita measure…maka kita pakai ANOVA untuk analisa
Kita harus buat hipothesis (andaian kajian kita berdasarkan fakta researcher yang lalu…
15 tahun lalu kita pakai hypothesis null dan hypothesis alternative
Kini kita pakai
HI:
H2:
H3:
contoh
Factors affecting Reliability coefficients
1. Range of scores…directly relationship between range of scorea and reliability
2. Length of test…directly relationship between length of test and reliability
3. Probability of guessing…investly…if probability low , the reliability is high
Biasa kita pakai P<0.01 and P<0.05
Long test is reliable than shorter test
r stand for correlation coefficient
P stand for probability
If P low…than r is high…investly related
If r low maka SE of measurement is high…invest relationship
If r is high…maka SE is low
SE stand for standard error
If SD high…maka SE also high…directly related with SE
SD and SE have directly relationship
Coefficient alpha is the mean of all possible split half correlitions correlated by Spearman-brown formula
R=correlation coefficient=reliability purpose=correlation between two or more variables
Administrating item analysis …to modified the r
Correlation coefficient=r=reliability
R=0.9=highly reliability
UIAM biasa pakai 0.64
Prof di sini biasa pakai 0.75 untuk nilai r bagi kajian sains social…
Bagi kajian sains…baiknya nialai r ialah 0.85
Validity is a test of truth or accuracy
Biasa kita pakai likert scale sebab senang ada paparkan nilai r for reliability of the test item…
Nilai r cronbach
Likert scale
Seperti
5_ strongly agree
4_agree
3_neutral
2_disagree
1_strongly disagree
Factors affecting Reliability coefficients
1. Range of scores…directly relationship between range of score and reliability
2. Length of test…directly relationship between length of test and reliability
3. Probability of guessing…investly…if probability low , the reliability is high
Biasa kita pakai P<0.01 and P<0.05
Long test is reliable than shorter test
r stand for correlation coefficient
P stand for probability
If P low…than r is high…investly related
If r low maka SE of measurement is high…invest relationship
If r is high…maka SE is low
SE stand for standard error
If SD high…maka SE also high…directly related with SE
SD and SE have directly relationship
Coefficient alpha is the mean of all possible split half correlitions correlated by Spearman-brown formula
R=correlation coefficient=reliability purpose=correlation between two or more variables
Administrating item analysis …to modified the r
Correlation coefficient=r=reliability
R=0.9=highly reliability
UIAM biasa pakai 0.64
Prof di sini biasa pakai 0.75 untuk nilai r bagi kajian sains social…
Bagi kajian sains…baiknya nialai r ialah 0.85
Validity is a test of truth or accuracy
Biasa kita pakai likert scale sebab senang ada paparkan nilai r for reliability of the test item…
Nilai r cronbach
Likert scale
Seperti
5_ strongly agree
4_agree
3_neutral
2_disagree
1_strongly disagree
أَلَمْ تَرَ أَنَّ اللَّهَ يُسَبِّحُ لَهُ مَنْ فِي السَّمَاوَاتِ وَالأرْضِ وَالطَّيْرُ صَافَّاتٍ كُلٌّ قَدْ عَلِمَ صَلاتَهُ وَتَسْبِيحَهُ وَاللَّهُ عَلِيمٌ بِمَا يَفْعَلُونَ Tidakkah kamu tahu bahwasanya Allah: kepada-Nya bertasbih apa yang di langit dan di bumi dan (juga) burung dengan mengembangkan sayapnya. Masing-masing telah mengetahui (cara) solat dan tasbihnya, dan Allah Amat Mengetahui apa yang mereka kerjakan. an-Nur:41
Tazkirah
Sami Yusuf_try not to cry
mu'allim Muhammad Rasulullah Sallallahu alaihi waSalam
ummi_mak_mother_ibu_Sami Yusuf
zikir Tok Guru Nik Abdul Aziz Nik Mat Mu'allimul Mursyidi
syeikh masyari afasi
ruang rindu
song
Arisu Rozah
Usia 40

Mudah mudahan diluaskan rezeki anugerah Allah
usia 40 tahun

UPM

Kuatan Pahe Darul Makmur
pemakaian serban semsa menunaikan solat_InsyaAllah ada sawaaban anugerah Allah
Rempuh halangan

Abah_menyokong kuat oengajian Ijazah UPM

usia 39 tahun

usia 23 tahun_UPM
An_Namiru

Ijazah Pengurusan Hutan UPM

General Lumber_Nik Mahmud Nik Hasan

Chengal

Tauliah

Semasa tugas dgn general lumber

PALAPES UPM

UPM

Rumah yang lawa

Muhammad_Abdullah CD
semasa bermukim di Kuatan Pahe Darul Makmur
Ijazah

air terjun

Borneo land

GREEN PEACE
GREEN PEACE
Kelang

Ahlul Bayti_ Sayid Alawi Al Maliki

Asadu_ Tenang serta Berani

atTiflatul Falasthiniin

Sayid Muhammad Ahlul Bayt keturunan Rasulullah

AnNamiru_SAFARI_Kembara

AnNamiru_resting

Hamas

sabaha anNamiru fil nahri

Namir sedang membersih

Tok Guru Mualimul_Mursyid

An_Namiru
.jpg)
Namir_istirehat
.jpg)
SaaRa AnNamiru fil_Midan
.jpg)
Renungan Sang Harimau_Sabaha AnNamiru
.jpg)
Syaraba AnNamiru Ma_A
.jpg)
AnNamiru_Riadhah
.jpg)
AnNamiru_Riadhah
.jpg)
AnNimru ma_A waladuha
Namir fil_Ghabi (sebut Robi...
Namir

AdDubbu_Beruang di hutan

Amu Syahidan Wa La Tuba lil_A'duwwi

AsSyahid

Namir

Tangkas
najwa dan irah

sungai

najwa

najwa

Kaabatul musyarrafah

unta

Jabal Rahmah

masjid nabawi

masjid quba

dr.eg

najwa dan hadhirah

along[macho]
![along[macho]](https://blogger.googleusercontent.com/img/b/R29vZ2xl/AVvXsEjuMi7D33CmR0_KXrCW2XigfLcUuQurcvtqOS139ncCwEzCyB-jUopk7QK7anADIenJEm2S0N6gAY1ubnACYXewgiAsI3rBjnLTawM39alLL-rEopOoVqn0w5WpLhPJH3hrXNtchEhgtyaI/s240/P7150023.JPG)
harissa dan hadhirah

adik beradik
Tongkat Ali

Tongkat Ali
herba kacip Fatimah
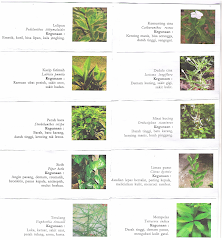
herba Kacip Fatimah
hempedu beruang
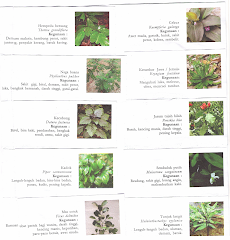
hempedu beruang
hempedu bumi

hempedu bumi
herba misai kucing

herba misai kucing
herba tongkat Ali
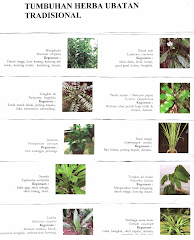.png)
Tongkat Ali
Ulama'

Ulama'
kapal terbang milik kerajaan negara ini yang dipakai pemimpin negara

kapal terbang
Adakah Insan ini Syahid

Syahid
Tok Ayah Haji Ismail

Saifuddin bersama Zakaria

Dinner....
Sukacita Kedatangan Tetamu
Pengikut
Kalimah Yang Baik

Ubi Jaga

Ubi Jaga
Arkib Blog
Burung Lang Rajawali

Chinese Sparrowhawk
Kelicap Mayang Kelapa

Brown-Throated Sunbird
Kopiah

Pokok Damar Minyak

Kacip Fatimah

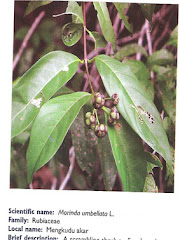
Mengkudu Akar
