Total reliability
Case Processing Summary
N %
Cases Valid 215 99.5
Excluded(a) 1 .5
Total 216 100.0
a Listwise deletion based on all variables in the procedure.
Reliability Statistics
Cronbach's Alpha N of Items
.871 20
Reliability even
Case Processing Summary
N %
Cases Valid 215 99.5
Excluded(a) 1 .5
Total 216 100.0
a Listwise deletion based on all variables in the procedure.
Reliability Statistics
Cronbach's Alpha N of Items
.756 10
Reliability odd
Case Processing Summary
N %
Cases Valid 215 99.5
Excluded(a) 1 .5
Total 216 100.0
a Listwise deletion based on all variables in the procedure.
Reliability Statistics
Cronbach's Alpha N of Items
.793 10
Correlations
swbtotal rwbtotal ewbtotal setotal retotal lstotal
swbtotal Pearson Correlation 1 .937(**) .934(**) .117 -.144(*) .380(**)
Sig. (2-tailed) .000 .000 .086 .035 .000
N 215 215 215 215 215 215
rwbtotal Pearson Correlation .937(**) 1 .749(**) .083 -.125 .272(**)
Sig. (2-tailed) .000 .000 .226 .068 .000
N 215 215 215 215 215 215
ewbtotal Pearson Correlation .934(**) .749(**) 1 .137(*) -.144(*) .441(**)
Sig. (2-tailed) .000 .000 .044 .034 .000
N 215 215 215 215 215 215
setotal Pearson Correlation .117 .083 .137(*) 1 -.611(**) .260(**)
Sig. (2-tailed) .086 .226 .044 .000 .000
N 215 215 215 215 215 215
retotal Pearson Correlation -.144(*) -.125 -.144(*) -.611(**) 1 -.111
Sig. (2-tailed) .035 .068 .034 .000 .104
N 215 215 215 215 215 215
lstotal Pearson Correlation .380(**) .272(**) .441(**) .260(**) -.111 1
Sig. (2-tailed) .000 .000 .000 .000 .104
N 215 215 215 215 215 215
** Correlation is significant at the 0.01 level (2-tailed).
* Correlation is significant at the 0.05 level (2-tailed).
Saifuddin,
Dr Sohail.
1) Title of the project
2) Introduction ( background of the study, objective, statement of problem, significance of the study, limitation, and decimation if any.)
3) Literature Review
4) Data analysis and finding
5) Conclusion, comment and recommendations.
6) References/bibliography
Reliability=coefficient correlation= alpha= biasa nak 0.75 hinggga 0.9 highly reliable
Validity ada dua jenis:
1.convergent
2.discriminant
Cuba lihat scree plot adakah negative atau posotif
Jika positive mean ada hubungan antara variable yang cuba dihubungkan mean directly relationship
Jika negative mean investly relationship
Nilai validity kita rujuk kepada nilai standard error…jika SE tinggi mean tidak valid…low validity
Content validity describes a judgment of how adequately a test samples behaviour representative of the universe of behaviour that the test was designed to sample. (Cohen & Swerdlik, 2005).
Standard Error of Estimate
Assuming SD = 10 and criterion-related validity = .36
Jika SE rendah mean high validity
Jika SD tinggi biasanya SE jua tinggi…
P<0.05.... mean 95% ada significant relationship...mean highly reliability relationship between the variable
P<0.01...mean 99% ada significant relationship...mean highly significant relationship between the variables
Jika dua categories (biasanya variable…kita pakai T test…atau Chi Square
Jika tiga (>2…categories / variable yang kita measure…maka kita pakai ANOVA untuk analisa
Kita harus buat hipothesis (andaian kajian kita berdasarkan fakta researcher yang lalu…
15 tahun lalu kita pakai hypothesis null dan hypothesis alternative
Kini kita pakai
HI:
H2:
H3:
contoh
Usia 40

Mudah mudahan diluaskan rezeki anugerah Allah
usia 40 tahun

UPM

Kuatan Pahe Darul Makmur

pemakaian serban semsa menunaikan solat_InsyaAllah ada sawaaban anugerah Allah

Rempuh halangan
Abah_menyokong kuat oengajian Ijazah UPM

usia 39 tahun

usia 23 tahun_UPM

An_Namiru

Ijazah Pengurusan Hutan UPM

General Lumber_Nik Mahmud Nik Hasan

Chengal

Tauliah

Semasa tugas dgn general lumber

PALAPES UPM

UPM

Rumah yang lawa

semasa bermukim di Kuatan Pahe Darul Makmur
Ijazah

air terjun

Borneo land

GREEN PEACE

Kelang

Ahlul Bayti_ Sayid Alawi Al Maliki

Asadu_ Tenang serta Berani

atTiflatul Falasthiniin

Sayid Muhammad Ahlul Bayt keturunan Rasulullah

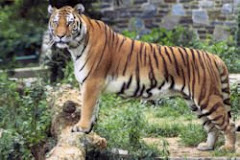
AnNamiru_SAFARI_Kembara

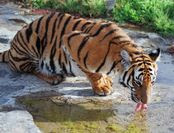
AnNamiru_resting

Hamas

sabaha anNamiru fil nahri

Namir sedang membersih

Tok Guru Mualimul_Mursyid

An_Namiru
.jpg)
Namir_istirehat
.jpg)
SaaRa AnNamiru fil_Midan
.jpg)
Renungan Sang Harimau_Sabaha AnNamiru
.jpg)
Syaraba AnNamiru Ma_A
.jpg)
AnNamiru_Riadhah
.jpg)
AnNamiru_Riadhah
.jpg)
AnNimru ma_A waladuha

Namir fil_Ghabi (sebut Robi...

Namir

Kijang_ makanan berkhasiat...

Seladang fil_Ghabi (sebut Robi...

Tangkas_Perkasa_ berkhasiat
AnNamiru fil_Ghabi (sebut Robi)

Tangkas_Berani
AdDubbu_Beruang di hutan

Amu Syahidan Wa La Tuba lil_A'duwwi

AsSyahid

Namir

Tangkas
najwa dan irah

sungai

najwa

najwa

Kaabatul musyarrafah

unta

Jabal Rahmah

masjid nabawi

masjid quba

dr.eg

najwa dan hadhirah

along[macho]
![along[macho]](https://blogger.googleusercontent.com/img/b/R29vZ2xl/AVvXsEjuMi7D33CmR0_KXrCW2XigfLcUuQurcvtqOS139ncCwEzCyB-jUopk7QK7anADIenJEm2S0N6gAY1ubnACYXewgiAsI3rBjnLTawM39alLL-rEopOoVqn0w5WpLhPJH3hrXNtchEhgtyaI/s240/P7150023.JPG)
harissa dan hadhirah

adik beradik
Tongkat Ali

Tongkat Ali
herba kacip Fatimah
herba Kacip Fatimah
hempedu beruang
hempedu beruang
hempedu bumi

hempedu bumi
herba misai kucing

herba misai kucing
herba tongkat Ali
.png)
Tongkat Ali
Ulama'

Ulama'
kapal terbang milik kerajaan negara ini yang dipakai pemimpin negara

kapal terbang
Adakah Insan ini Syahid

Syahid
Tok Ayah Haji Ismail

Saifuddin bersama Zakaria

Dinner....
Sukacita Kedatangan Tetamu

Kalimah Yang Baik

Ubi Jaga
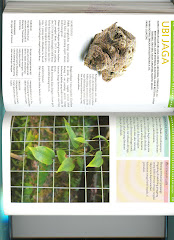
Ubi Jaga
Burung Lang Rajawali

Chinese Sparrowhawk
Kelicap Mayang Kelapa
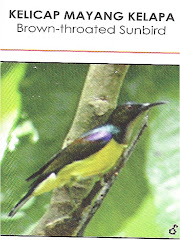
Brown-Throated Sunbird
Kopiah

Pokok Damar Minyak

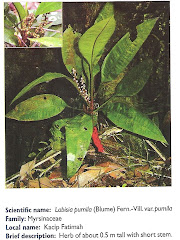
Kacip Fatimah
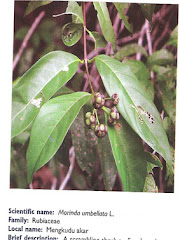
Mengkudu Akar